1. Overview
To understand how Google handles a broad commercial query, we reviewed 20 unique first-page results for “running shoes” in the United States on 14 July 2026.

The sample includes brands, retailers, editorial publishers, specialist review platforms, a marketplace, and a community discussion. Each page was assessed across content structure, commercial functionality, editorial signals, internal linking, structured data, and user-experience features.
The objective was not to identify a ranking formula or claim that a specific feature causes higher positions. The goal was to understand which page formats Google accepts for the same query, what each format does well, and what SEO teams can apply to their own page strategy.
2. A Mixed-Intent SERP
The first page is not dominated by one page type. Google combines:
- Ecommerce category pages
- Editorial buying guides
- Brand homepages
- Review catalogues
- A marketplace
- Community content


This distribution confirms that “running shoes” combines several forms of intent:
- Informational: understanding which type of shoe to choose
- Commercial investigation: comparing brands, models, and use cases
- Transactional: browsing products and preparing to purchase
- Experiential: reading opinions and firsthand user experiences
This means the competitive set extends beyond direct commercial competitors. A product category may compete with a buying guide, a specialist review database, a marketplace, or a Reddit discussion.
3. Why Different Page Types Rank
The strongest distinction in the sample is between editorial pages and ecommerce pages.
Editorial guides
Editorial guides typically include:
- Named authors
- Testing methodology
- Product comparisons
- Expert input
- Update dates
- Affiliate disclosures
- Supporting guides and model-specific reviews
Ecommerce category pages
Ecommerce categories typically include:
- Prices
- Filters and sorting
- Ratings and reviews
- Stock information
- Shipping and return details
- Wishlists and purchase controls
- Product and category navigation
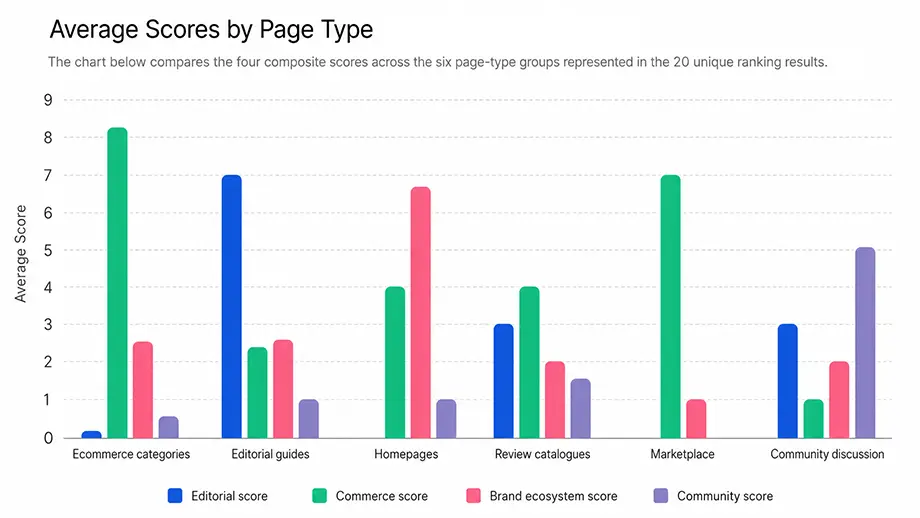
The implication is not that every page should maximise every available feature. Each page format needs to perform its primary function well.
Editorial pages provide decision support. Ecommerce categories reduce friction in product discovery and purchase. Brand homepages connect users to a wider ecosystem. Review catalogues structure large volumes of comparison data. Community content provides authentic user experience.
Hybrid pages remain strategically relevant
Some pages combine editorial depth with commercial functionality. Wirecutter is the clearest example in this sample, combining testing, comparisons, and authorship with pricing, retailer links, and product availability.
This hybrid model is especially relevant for affiliate publishers, specialist review sites, retailer buying guides, and brands creating product-selection resources.
4. Internal Discovery and Feature Prevalence
Related content and navigation appear across almost all ranking pages. Successful results frequently connect users to:
- Individual product reviews
- Related product categories
- Specialist buying guides
- Brand and model pages
- Supporting educational content

These findings show that leading pages tend to operate within broader product, brand, editorial, or community ecosystems.
5. Word Count and Internal Linking
Word count follows page function
Editorial guides are substantially longer than ecommerce categories and brand homepages. That does not mean every ranking page needs more copy.

Editorial guides require depth because they explain, compare, and recommend. Category pages rely more heavily on product data, filters, ratings, and transactional functionality.
The relevant question is not “How many words should this page have?” It is “Does the content provide everything required for the page’s role?”
Internal link volume reflects architecture
Ecommerce categories have the highest median number of internal links, followed by brand homepages and editorial pages.

The reason is structural. Ecommerce pages connect products, categories, facets, services, and transactional pages. Editorial pages connect guides, reviews, and topic clusters. Brand homepages distribute users across the wider brand ecosystem.
Build an internal linking architecture that guides users toward relevant next steps, improves content discovery, and strengthens relationships between related topics.
6. Practical Takeaways for SEO Teams
Editorial publishers
Prioritise:
- Original testing and firsthand evaluation
- Clear authorship and expert credentials
- Transparent methodology
- Structured product comparisons
- Regular updates
- Supporting topic clusters and model-level reviews
Ecommerce teams
Prioritise:
- Useful filters and sorting
- Accurate pricing and stock information
- Ratings and reviews
- Shipping and return transparency
- Concise category-level buying guidance
- Strong links between products, categories, and supporting content
Brands
Support product and category pages with:
- Shoe finders and selection tools
- Technology explanations
- Use-case recommendations
- Athlete or expert content
- Editorial resources
- Membership, community, and sustainability information
Review and affiliate sites
Differentiate through:
- Firsthand product evaluation
- Clear comparison criteria
- Expert authorship
- Accurate pricing and availability
- Visible affiliate disclosures
- Clear separation between editorial judgement and monetisation
7. Main Conclusion
The “running shoes” SERP does not reveal one ideal page template.
It shows that Google ranks different formats because they satisfy different parts of the search journey:
- Editorial guides provide expertise and comparison.
- Ecommerce categories provide product discovery.
- Review platforms provide structured evaluation.
- Brand homepages provide ecosystem navigation.
- Community pages provide firsthand validation.
For SEO experts, the practical priority is to define the role of the page before selecting its content, features, and internal-linking model.
The strongest page is not necessarily the one with the most content, links, or structured data. It is the one whose structure, content, and functionality are best aligned with the user need it is intended to satisfy.
Optimise the page for its role in the search journey, not for a generic checklist of features.
8. Methodology and Limitations
This benchmark is based on 20 unique first-page Google results for the query “running shoes.”
The pages were reviewed across structural, editorial, commercial, and technical variables, including:
- Publisher and page type
- Primary and secondary search intent
- Editorial and commercial features
- Word count and heading structure
- Internal links and related content
- Schema.org structured data
- Brand and community signals
The findings are directional insights from one competitive SERP. They should not be interpreted as universal ranking rules or evidence that any individual feature directly caused a page to rank.
The current dataset does not include off-page metrics such as backlinks, referring domains, Domain Rating, URL Rating, page age, or historical ranking movement.
9. Frequently Asked Questions
The query has mixed intent. Users may want product education, comparisons, direct shopping options, or firsthand opinions. The diversity of ranking formats reflects these different needs.
Ecommerce category pages are the largest group, representing 8 of the 20 unique results, or 40% of the sample. Editorial guides are the second-largest group at 25%.
Not necessarily. Category pages in the benchmark generally rely more on product discovery, filtering, ratings, pricing, stock, and transactional usability than on editorial length. Concise buying guidance can still be useful when it supports selection.
Editorial guides need enough depth to explain product differences, testing criteria, use cases, and recommendations. Their page function requires more context than a product-listing page.
This benchmark does not establish causation. Higher link counts often reflect site architecture, product inventory, navigation, and page purpose. Internal links should be assessed by relevance, destination, context, and user value rather than quantity alone.
Related content, breadcrumb navigation, prices, filters, ratings, and Product structured data were among the most frequently detected features. Editorial trust signals were concentrated mainly on publisher and review pages.
No. Product Schema was common but not universal. It should be treated as a supporting implementation that helps search engines understand page content and may support enhanced search features, not as a standalone explanation for rankings.
Teams should prioritise product discovery, filtering, accurate pricing and stock, reviews, shipping and return clarity, useful category guidance, and strong links between products, categories, and supporting content.
Editorial publishers should focus on original testing, transparent methodology, expert authorship, structured comparisons, visible disclosures, regular updates, and strong supporting content clusters.
They can inform hypotheses, but they should not be applied as universal rules. The same framework should be repeated across more queries, industries, devices, and dates before drawing broader conclusions.
The full page-level dataset is available in a public Google Sheet, including page classifications, extracted metrics, feature flags, and composite benchmark scores.
Access the full dataset: Review the page-level classifications, extracted metrics, feature flags, and benchmark scores in the Running Shoes E-Commerce Ranking Benchmark spreadsheet